The most common Forex trading platform in the world is Metatrader 4, often referred to as MT4. There are 3 types of charts that you can view price action data with: Bar, Line and Candlestick. All of them have their merit, one of them stands out above the rest. Candlesticks tell a story of how each period develops, not just the open and close that a line chart will show. For this reason, the way a candlestick is formed is often a signal of what’s to come for traders. Below is what a Candlestick Chart looks like:

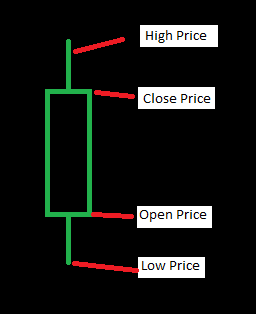
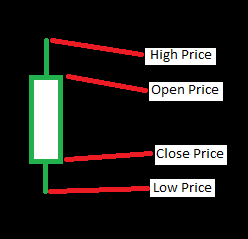
The name is short for “Japanese Candlestick” and these charts offer more information at a glance than Line Charts and Bar Charts. They are also known as Box and Whisker Plots. Each candlestick is an illustration of the high price, low price, open price, and close price. Below is how they can be read:
Bullish Candle:
By default in MT4, and shown above, candles with a higher close price than open price are hollow green. These candles show a period of Bullish activity.
Bearish Candle:
Candles with a lower close price than open price are shown as White. These candles show Bearish activity.
TRADING WITH JAPANESE CANDLESTICKS – SIGNALS OF MARKET PSYCHOLOGY
The best part about trading with candlesticks is that they present a lot of information to the naked eye. Open, close, high, and low prices can tell a story about the emotions present in the marketplace. Speculating a market turn using candlesticks is something that should be done with the right amount of data.
Candlesticks tell stories. In conjunction, candlesticks on different time frames tell different stories. Ever watched a movie and guessed the ending based on the emotional swings? This isn’t much different psychologically. Expectations, fear, confidence, and twists in information are driving the Forex almost like your favorite tear jerker of a movie drives your emotions.
THE DAILY TIME FRAME – Every Traders’ Friend
At the beginning of every day, bankers, government officials, news writers, hedge fund managers, market makers, import/export companies and traders get to look at the market with a fresh set of eyes. A full day of market emotion can tell a story. The actions of what the market did yesterday may be a clear indicator of what is in store for the coming days.
The daily time frame will be important for EVERY trading strategy. If you are Position or Swing trading, then you will likely use it to find good entry points. Scalpers, also known as Day Traders, wouldn’t dream of speculating the outcome of today without looking at yesterday. Scalpers will likely look at smaller time frames as well to further analyze the activity of each day, and these same short-term traders would be foolish to ignore what the long-term trend is doing.
MONTHLY AND WEEKLY TIME FRAME – The Long-Term Trend
Higher time frames present more information per candlestick… so the signal from each candlestick contains more powerful information purely from a statistics standpoint. There is also an important fundamental reason for the value of the monthly and weekly time frames.
Institutions like the Federal Reserve are NOT Day Trading. The Federal Open Market Committee (FOMC) meets 8 times per year, or every 6.5 weeks. This means they aren’t adjusting their stance or influence based on one day of data in most cases. Candles that form when a government shows their cards are powerful and could indicate long-term trend direction. The government shows their cards one day, and you get to see how the market reacts for days to come.
Candlesticks of Fear – Pin Bars
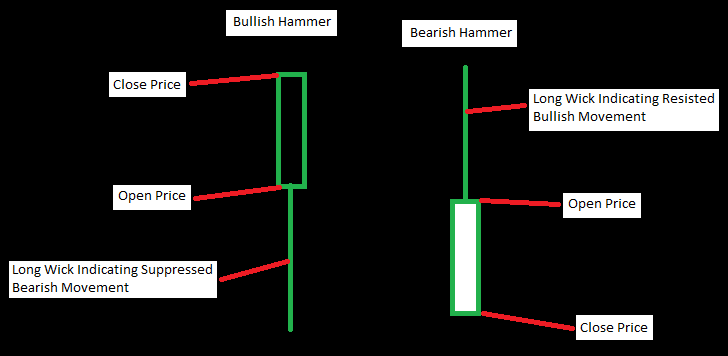
Sometimes the market will open, move definitively up or down, and then return to a price near it’s opening price. This indicates a certain level of fear in the marketplace that is forcing the market to turn and go back to where it started. This indicates an evening up in the battle between the bulls and the bears.
These are strong signals, however they usually come with a degree of uncertainty so tread lightly. For example, they may show a long wick on bottom showing a suppressed downward move indicating the bulls are making a move. At the same time, the total move for the day might be a net bearish (or downward) move. There are Bearish and Bullish Pin Bars. Below is what these might look like:
Candlesticks of Confidence – Engulfing candles
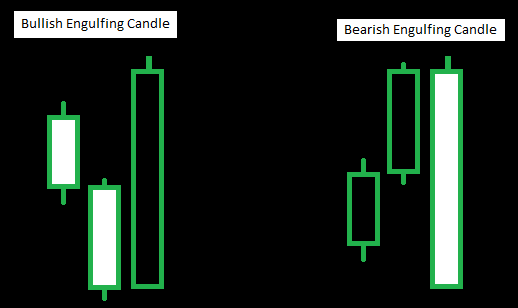
On the other hand, the market also makes moves based on confidence. Moves of confidence are often shown with a long-bodied candle that eclipses the market balance from the previous candlestick. These often occur around things like interest rate decisions, stated changes in fiscal policy, elections, employment reports, manufacturing sector performance, and other events. It may simply happen at a critical price point such as Support, Resistance, or a Pivot.
When an engulfing candle floods the market with confidence, it can be bullish or bearish. This means that the attitude of the market is biased as one or the other. Any time that a candlestick eclipses 60% or more of the previous candle, then bias may be turning. The more pronounced the candle, the stronger the bias. These are strong signals, a little more reliable than Pin Bars if you are trend trading.
Candlesticks of Uncertainty – Spinning Tops
Uncertainty occurs when the market seems to move a lot, however winds up right where it started to begin with. Exhibited by long wicks and short bodies, these are not a signal to get into the market unless you are trading some sort of a straddle type of strategy. They are neither bullish or bearish. Below is what they look like:
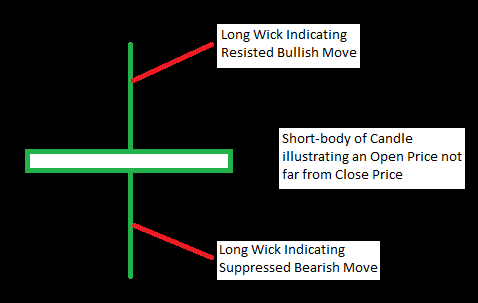
This is somewhat of a market stand-off, and whoever makes the first move loses. Wait for the market to decide direction before you decide to jump on the bandwagon if you want to increase your chances. Follow the trend, don’t try to control the market.
Combo Candles – Hammers
Combo candles are showing the strongest signal of all candlestick types. Fear on the part of the bulls or bears, and confidence for the opposing side. A decisive come from behind victory for one side with a promise of continued dominance. This is the equivalent of touching the stovetop in your kitchen, you reach down and touch it slowly, only to rip your hand away quickly. Won’t do that again, right?
There are decisively Bullish Hammers and Bearish Hammers. Below is what a Hammer candlestick might look like:

SUMMARY
There are Bulls and Bears that battle it out on all time frames. The bigger the animal, the largest being central banks and governments, the more you should pay attention to the effects of their moves. The larger the effect, the more prevalent it will be shown in candlesticks on time frames like the Daily, Weekly, and Monthly. If you plan to trade with price action or technical analysis, this is a tool you will want to have on your belt.
Trading is essentially betting on a game between those who want lower prices (Bears) and those who want to raise prices (Bulls). Each side can show fear, confidence, and uncertainty in differing amounts. Candlesticks exhibit an illustration of these emotions during a given period at the glance of an eye. They can be valuable signals of what the next move is likely to be. Pay attention to this and you can be a shark in the water.